Performance snapshot of major global stock markets in September. Can this rally continue specially in emerging markets?
Wall Street Billionaire Traders Lifestyle
If you are an aspiring stock market investor or trader and want's a peek into the fortune and lifestyle of some of most successful traders like Steven Cohen, Paul Tudor Jones, Louis Bacon etc on wall street then the following documentary is for you.
As some one rightly said "desire is the first step of any achievement", this video is definitely going to stimulate your desire to be a billionaire.
As some one rightly said "desire is the first step of any achievement", this video is definitely going to stimulate your desire to be a billionaire.
U.S long term Interest Rate Chart - 200 Years
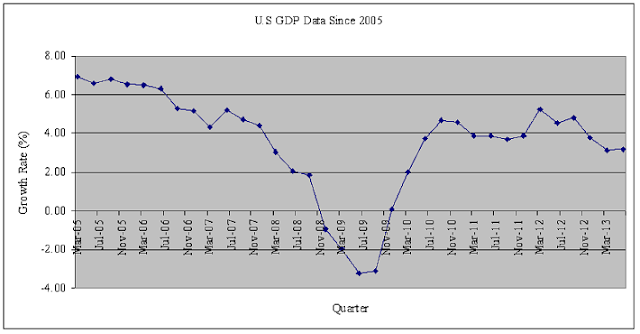
U.S GDP Historical Data & Quarterly Growth Rate
 |
| U.S GDP Growth Rate Chart since 2005 |
- The U.S Economy contracted for four consecutive quarters post financial crisis in 2008.
- The economy registered a growth rate of around 7% in the first quarter of year 2005, more than the GDP growth rate of many emerging economies today. Such high growth rate in U.S during 2005- 06 led to very high GDP growth rate of 8 to 10% in emerging Asian economies such as India, China and Brazil who benefited from increased exports.
- With moderated GDP growth rate in United States and Europe, Asian economies such as India and China has seen moderation in GDP growth rate post Lehman Crisis.
IT Service Companies Valuation comparison
With gradual US and Europe recovery, the most likely beneficiaries are global IT service companies and the stock of top 10 IT solution providers are already reflecting the optimism. Most of them are at 52 week high and are trading at the higher end of the last 5 years valuation range.
However within IT space some companies, which have higher growth rates and superior return ratios, are commanding relatively much higher valuation than their peers. For instance TCS is trading at 27 times PE multiple vs it's closest comparative competitor Accenture which is trading at just 17 times based on trailing 12 months EPS. IBM the largest of the pack is trading at 12.4 times TTM EPS.
However within IT space some companies, which have higher growth rates and superior return ratios, are commanding relatively much higher valuation than their peers. For instance TCS is trading at 27 times PE multiple vs it's closest comparative competitor Accenture which is trading at just 17 times based on trailing 12 months EPS. IBM the largest of the pack is trading at 12.4 times TTM EPS.
Subscribe to:
Comments (Atom)
Popular Posts
-
Jim Cramer a popular name on Wall Street and CNBC and a successful trader and investors with decades of trading experience has set out 2...
-
U.S GDP Growth Rate Chart since 2005 The U.S Economy contracted for four consecutive quarters post financial crisis in 2008. The ec...
-
Sharply falling Indian Rupee , which has crashed more than 20% since 1st May 2013, is giving sleepless night to importers and RBI but cos...
-
For all those savvy investors and traders there are many iPhone apps that can help you stay updated and agile and make your informed moves....
-
If you are an aspiring stock market investor or trader and want's a peek into the fortune and lifestyle of some of most successful t...


