 |
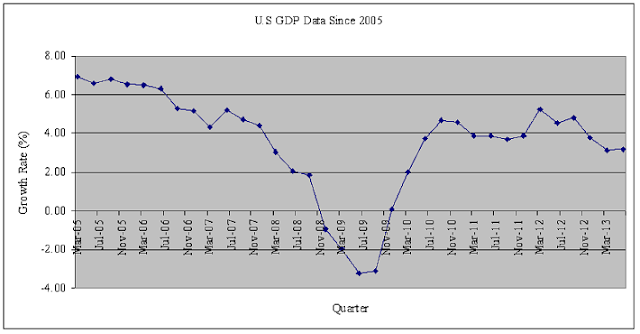
| U.S GDP Growth Rate Chart since 2005 |
- The U.S Economy contracted for four consecutive quarters post financial crisis in 2008.
- The economy registered a growth rate of around 7% in the first quarter of year 2005, more than the GDP growth rate of many emerging economies today. Such high growth rate in U.S during 2005- 06 led to very high GDP growth rate of 8 to 10% in emerging Asian economies such as India, China and Brazil who benefited from increased exports.
- With moderated GDP growth rate in United States and Europe, Asian economies such as India and China has seen moderation in GDP growth rate post Lehman Crisis.
| Quarter | GDP ($ Trillion) | GDP Growth Rate(%) |
| Jun-13 | 16.67 | 3.16 |
| Mar-13 | 16.54 | 3.12 |
| Dec-12 | 16.42 | 3.79 |
| Sep-12 | 16.36 | 4.80 |
| Jun-12 | 16.16 | 4.53 |
| Mar-12 | 16.04 | 5.25 |
| Dec-11 | 15.82 | 3.87 |
| Sep-11 | 15.61 | 3.72 |
| Jun-11 | 15.46 | 3.90 |
| Mar-11 | 15.24 | 3.89 |
| Dec-10 | 15.23 | 4.60 |
| Sep-10 | 15.05 | 4.66 |
| Jun-10 | 14.88 | 3.77 |
| Mar-10 | 14.67 | 2.02 |
| Dec-09 | 14.56 | 0.07 |
| Sep-09 | 14.38 | -3.10 |
| Jun-09 | 14.34 | -3.24 |
| Mar-09 | 14.38 | -1.98 |
| Dec-08 | 14.55 | -0.95 |
| Sep-08 | 14.84 | 1.85 |
| Jun-08 | 14.82 | 2.07 |
| Mar-08 | 14.67 | 3.02 |
| Dec-07 | 14.69 | 4.41 |
| Sep-07 | 14.57 | 4.74 |
| Jun-07 | 14.52 | 5.22 |
| Mar-07 | 14.24 | 4.32 |
| Dec-06 | 14.07 | 5.16 |
| Sep-06 | 13.91 | 5.30 |
| Jun-06 | 13.8 | 6.32 |
| Mar-06 | 13.65 | 6.47 |
| Dec-05 | 13.38 | 6.53 |
| Sep-05 | 13.21 | 6.79 |
| Jun-05 | 12.98 | 6.57 |
| Mar-05 | 12.82 | 6.92 |


No comments:
Post a Comment